I was looking up some basic dividend information on GE and an interesting thing happened. I noticed that the numbers on Yahoo! Finance didn’t make sense. I’d like to share my thought process as a way to help you get comfortable with dividend math.
It’s important to gain a very basic knowledge of what the dividend numbers we’ve been using mean so you can make better decisions & feel empowered. You won’t feel empowered if you’re confused, yet it seems that companies providing financial information go out of their ways to make it confusing!
A Word on Stock Prices
During market open it’s normal for the stock price on different websites to vary. Sites like Yahoo! and Google use delayed pricing information, and the delays can vary from site to site, or even at different times within a site. Delayed pricing is good enough for research. If you see two different prices, you should understand that it’s because the places you are looking have different delays. This doesn’t really matter to us, but you should know what’s going on.
Dividend Details
Dividend information can be presented two different ways, as a quarterly amount or an annual amount. I noticed an error on Yahoo!’s GE chart, so went to Google Finance to have a look. While Yahoo! presents the dividend amount as an annual amount, Google presents the quarterly number. Be careful when looking at dividend information and make sure you know which you are looking at! There are a couple of ways to tell, but first, the error.
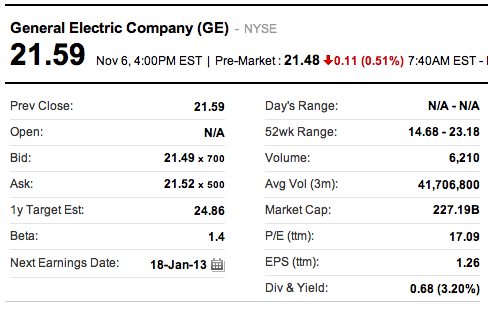
Here’s the GE chart from Yahoo!:
Because the numbers don’t scare me, I always double check what I see. I calculated the yield from Yahoo!‘s numbers to be 0.68÷21.59 = 3.149% (which rounds off to 3.15%). When I went back to Yahoo! I noticed that it said 3.20%. I can’t explain this, I just know Yahoo! is giving me the wrong information. So, I went to Google to check what I was seeing.
Here’s the table from Google Finance:
Notice, the dividend and yield information are on the top right of the chart. Google Finance gives a yield that looks correct, but the dividend is much lower! It’s lower, because Google tells us the quarterly dividend amount, not the annual dividend amount.
We can figure this out very quickly, if we develop the habit of checking what we see. If you were to check the yield shown on Google against the stock price based on the dividend shows, you’d come up with 0.17÷21.59 = 0.79%. 0.79% is quite low, and I’d suggest if that were the real dividend it’s probably a company we shouldn’t use for our blueprint. But, how would you know what the right numbers are?
Well, knowing that sometimes dividends are presented as quarterly numbers, you might multiply 0.17×4, get 0.68, and calculate the yield of 3.15% which then makes sense. In Google’s case, if you hover the mouse over the words “Div/yield” it will tell you that it’s showing the latest quarterly dividend amount.
There are two other easy alternatives for finding out information about a company.
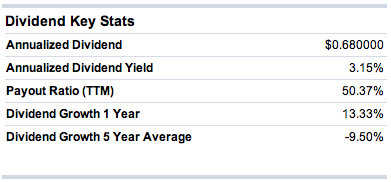
If you have a brokerage account you can look up detailed information about companies there. Brokerages often display information more clearly than public sites like Yahoo! and Google. For example, Fidelity’s dividend information on GE clearly states that we’re looking at annualized numbers:
A brokerage account also shows other important information that we’d like to know like payout ratio and dividend growth rates.
This information from Fidelity is available even if you don’t login, so you don’t even need an investment account to complete this sort of research using their site.
An even simpler way to be absolutely certain is to head back to the investor relations page on the company’s website. Dividend history is presented in a chart that shows the payments and dates they were paid. GE’s dividend history page shows the following:
You can clearly see that the quarterly payment is $0.17.
Take Away
It doesn’t matter whether you use quarterly or annual numbers in the Company Selection Worksheet, as long as you are consistent when comparing companies, and as long as you calculate the yield as an annual number by using the yearly dividend or multiplying the quarterly yield by 4.
Want access to our Dividend Stock Selection Worksheet? It’s Week 7 of our free 10-week Elephant’s Paycheck Blueprint for 401K Rollovers email course. Check it out.
Summary
Let’s summarize. We took a look at the stock price, dividend, and dividend yield. We calculated the yield, found an error on Yahoo! and then noticed that Google shows the dividend quarterly while Yahoo! shows it annually. It’s important to verify what you see, and that you become comfortable enough knowing what you are reading in order to become comfortable with the numbers (and what they mean). Finally, we double checked what we saw with Fidelity and the company’s investor relations site. Of course, you could have started with the investor relations page. However, learning to use all the different sites helps you become more fluent with dividend math which will serve you well over the long haul.


Let me know what you think